SoundScope VR Acoustic Analysis Module
SoundScope includes the following advanced features: RTA Bar graph, RTA Line graph, RTA Bar & FFT graph, and the Spectrograph.
Banding
You can select the banding for the plot from octave to 1/48th octave resolution.
The touch GUI allows you to pan and zoom both the frequency and magnitude scales, using the iOS pinch-zoom gestures. To fit the full plots to the screen, just double-tap.
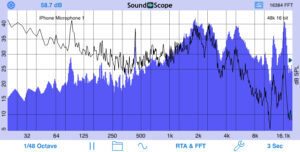
Select RTA Bars or lines, and optionally overlay the actual FFT plot on the display .
For plot decay, We can select a specific number of FFTs to average, or we can pick one of the exponential time decay options, from 1-10 seconds, or Fast or Slow. We can also select Infinite Averaging, which continuously averages FFTs, resulting in a very stable display that is the overall average of the run time.
Save / Recall
SoundScope supports saving, recalling, and exporting data to the local device or iCloud. You can save files by naming them, or, you can just hold your finger on the folder icon to automatically save a plot. Multiple plots can be displayed in different colors, and the cursor will read out the dB levels and frequency for each displayed plot. You can average all of the recalled plots, and you can turn on difference mode, which then shows the difference between the live and recalled plots.
Split Plot Mode
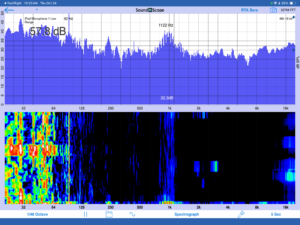
Now let’s setup split plot mode. In this mode, you can simultaneously display two plots, including adding a spectrograph to the display. Quieter sounds map towards the blue end of the spectrum, while louder sends show up as red, and then finally white as they reach the upper limit of the scale, which you can define.
Signal Generator
The app also includes a signal generator for pink noise or sine waves. You can output the generator signal to BT or airplay.
VR
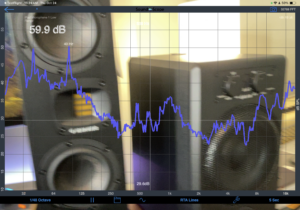
SoundScope supports advanced VR processing. Tap the camera icon to bring up the VR menu, and select Show Background Video. This sets the plot background to transparent, and starts the camera. The real-time plot and dB level are overlaid on top of the video.
We recommend selecting the dark screen background from our main Settings menu, and select the thick line option from the module settings page.
Screen Recording
You can also record this to your device by selecting Start Screen Recording from the same menu. Videos will be saved in your photo app.
Bluetooth and Airplay OutputSee our information about using Bluetooth or Airplay.
The frequency scale can be zoomed down to a single octave, and the dB scale can be zoomed down to 1dB resolution. Double-tap the screen to return to full frequency response, and to auto-scale the dB scale.
Real-time Spectrograph history is saved, just swipe to see sound events that have scrolled off the screen.
Other features include high-contrast mode, variable Spectrograph speed, vertical or horizontal running Spectrograph, Difference mode, Peak Tracking, and FFT Windowing.
All of the standard AudioTools features, such as Save / Recall and the Generator Panel are available. All settings are automatically saved and restored the next time that you run the app.
On iPad and most larger iPhones, split graph mode is available, so that you can put any two graphs on the screen at the same time.


