Transfer Function
The new Studio Six Digital Transfer function includes the most-used Transfer Function features in an easy-to-use GUI package.
With Transfer Function, you can make changes to a sound system without having to run pink noise or swept sine waves through the system. This allows you to monitor system performance, or make adjustments, while the system is in use and the crowd is in the room.
Since this module was developed solely by Studio Six Digital, and uses no Rational Acoustics Smaart code or algorithms, it is branded under our name only.

Available in AudioTools on the App Store
See our new demo video of Transfer Function:
Transfer Function is by definition a dual-channel measurement, and so to use it you need to either use a two-channel input device, or you will use the signal generator as the reference signal. iAudioInterface2 was designed specifically with Transfer Function in mind, since it includes a microphone input, and a second line input for the reference signal.
You can also use other two-channel interfaces, such as the original iAudioInterface or many of the generic 2-channel audio interfaces that work with iOS.
Using Transfer Function With A Single-Channel Input Device
Transfer Function can be used with a single-channel input device, such as the built-in iOS device microphone, iTestMic, or iPrecisionMic. In this case, you have to use the signal generator to make the reference signal.
To do this, you will need to use a cable that has an 1/8″ TRS 3-conductor plug on the end that plugs into the iOS device. If the plug has 4 conductors, the iOS device will turn off the built-in mic and look for a mic on that cable. The other end of the cable might be 2 RCA connectors, or it could be wired to an XLR or 1/4″ TRS plug. If you are using 2 RCA connectors, make sure you select “mono” for the generator output. If you are wiring to a balanced connector, like an XLR or 1/4″ TRS, make sure you select “balanced” for the generator output. Selecting the wrong mode will result in attenuated low frequency readings.
Next, make sure that the output cable is the last thing that you plug into the iOS device. Plug in the iTestMic or iPrecisionMic first, and then plug in the output cable.
Now open the generator panel by tapping the sine wave icon, select pink noise, and turn the generator on.
Next, start the Transfer Function running, using the Play/Pause button on the toolbar. You should start to get results at this time. Continue to the other steps described below, including setting the delay, to get accurate results.
Using Transfer Function With A Multi-Channel USB Audio Input Device
You can use Transfer Function with any USB audio device that the iOS device supports. For example, on the newer iPhones and most iPads, you can plug a USB audio interface in directly, although in many cases you will need to supply external power to the interface.
Once connected, you just need to assign the desired channels on the interface to the Measure Source and Reference Source in Transfer function. Typically the Measure Source will simply be a microphone that is set up in the room to pick up the sound system signal, and the Reference Source will be connected to the signal that is feeding the sound system.
By default, AudioTools will use the first input (left) as the Measure Source and the next input (right) as the Measure Source. You can reassign the input channels if you need to. To use a channel other than channel one for the microphone, connect your multichannel interface, and navigate to Settings->Channel Mapper. From here, you can select the channels from your interface for both the microphone source and for the line input source.
Using Transfer Function With iAudioInterface2
iAudioInterface2 is designed to work as an input device for Transfer function. Here are two common use cases.
We are assuming that you will be using a microphone, so in both cases you would have the mic plugged into the XLR input, as the Measure source.
Using the Internal Pink Noise Generator
For pink noise, on the Transfer Function Setup page, select Ref Source, and on the top, select Mic/Gen. Then just run a cable from the Line Output / Headphones jack to your system input. Turn on or off the pink noise using the sine wave icon on the main screen. Note that pink noise will only run when either the Delay Finder is on, or when the measurement is running.
Using Program Material as the Reference
You may be in a situation, such as during a live sound event, when it is not possible to run pink noise. In this case, you can use the actual sound from the event as the reference signal.
To set up for this, select Mic / Line on the Reference source page, and run an output from the sound system that is a mono mix of the audio going out to the room into the Line Input jack. Probably Mid gain will work, just check the little M R meters on the main screen for the levels. Now set the delay, and you are all ready to measure the system frequency response and phase while the music is playing.
Transfer Function on iPad
Here is Transfer Function on iPad, showing a running trace (green and blue), and a recalled trace (yellow and magenta). The coherence plots for both measurements are shown, in red and dark red:
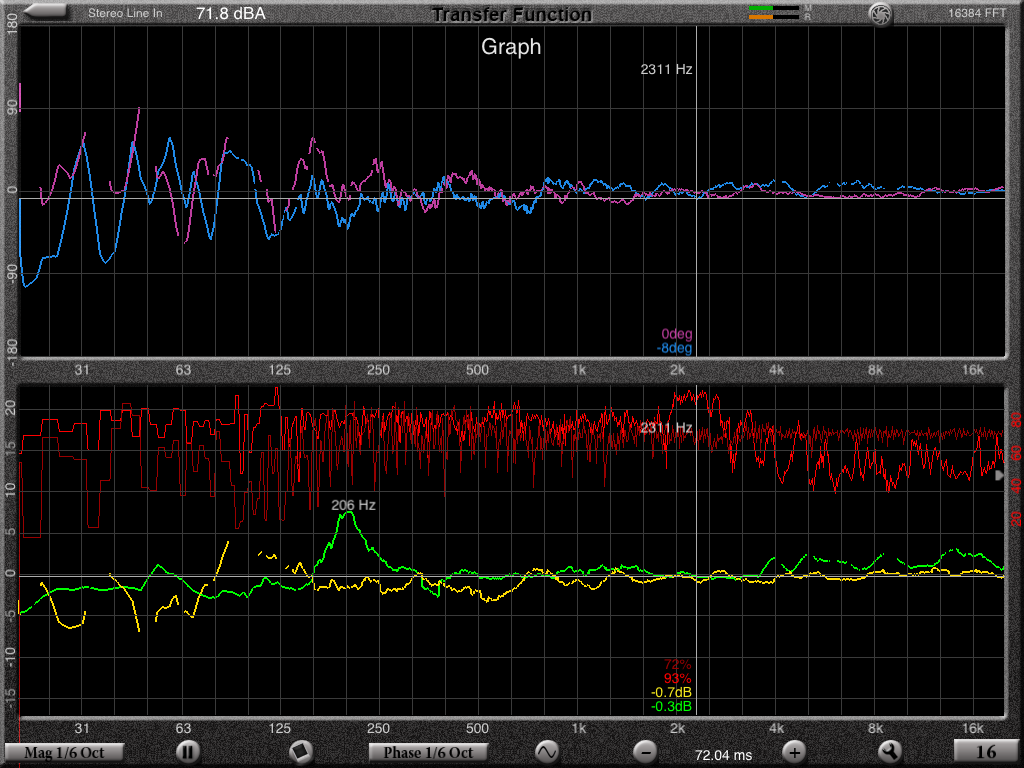
Included in Transfer Function are:
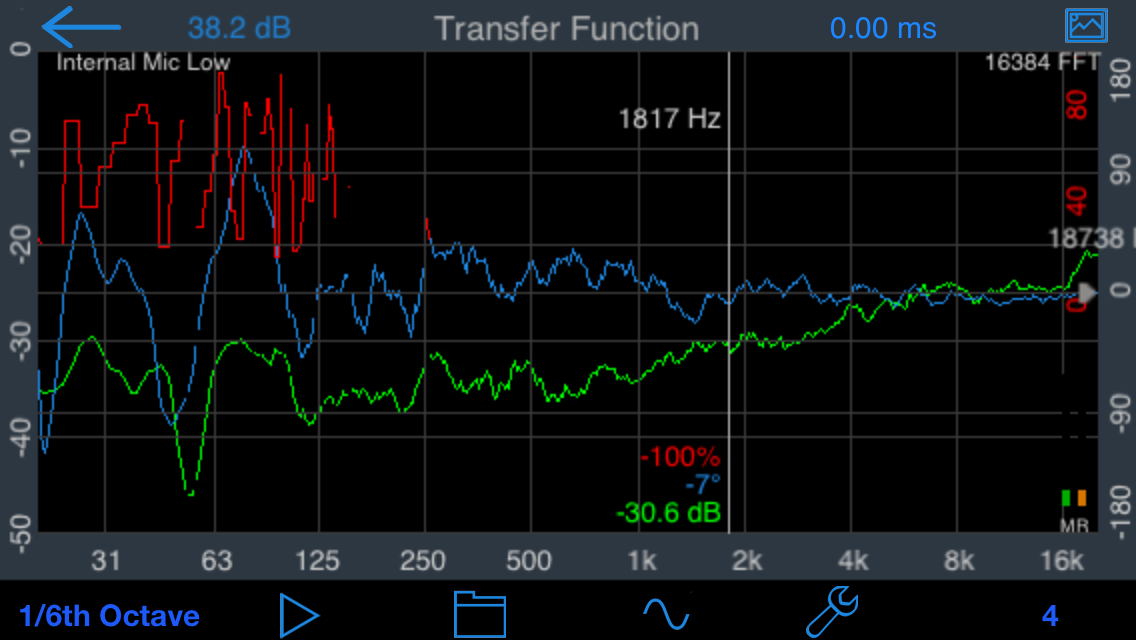
Magnitude Graph
The magnitude graph is used to show the difference between the reference signal and the test signal. Typically, the reference signal is pink noise, although you can also use mono program material (music) and still get good results.
The graph auto-centers around the 0 dB axis, so it’s easy to see how the test signal differs from the reference signal.
Phase Graph
The phase graph shows the relative phase of the signal, and is useful for setting crossover points.
Coherence Graph
The coherence graph is used as a measure of the reliability of a set of averaged transfer function measurements. 100% would mean that you are seeing highly correlated graphs, and thus the information on the magnitude and phase graphs would be accurate.
Coherence Blanking
It may be useful to only display transfer function plot data when the coherence is above a certain threshold. This helps you know that the information being shown is reliable. To do this, you can set a coherence blanking threshold in percent, on the setup screen.
When the blanking threshold is greater than 0, plot data will only be shown that has a corresponding coherence greater than the threshold.
Typical coherence blanking values are 20-50%.
Delay Finder
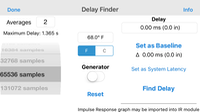
Transfer Function includes a sample-accurate, impulse-response based delay finder. This is a very powerful feature, and is used to set the delay for the most accurate Transfer Function measurements, and it can also be used as a standalone delay finder, to accurately measure the time arrival of a signal, for setting driver delays times.
Using Delay Finder to Set Up Transfer Function
Since it is critical that the time offset between the reference and test signal is known, there has to be a way to accurately compute the time delay between these signals. Our impulse response based delay finder does just this.
Just tap the delay value to bring up the Delay Finder panel. Select an FFT size, which sets the longest delay that you can measure, and tap Find. The delay will be computed, and shown on the screen. To average more than one FFT, enter a number larger than 1 in the Averages field. Averaging several FFTs can increase the accuracy of the results.
To calibrate the system to run the Transfer Function, place the microphone at the location that you will be testing, run the delay finder, and tap Set as Baseline. This is important, because the phase plot will not be correct if you have not time-aligned the output to the input.
Using Delay Finder to Time-Align Loudspeakers
To calibrate the system to compute relative delays, place the microphone at your zero distance. This may be the speaker grill, or the plane of the front of the driver that you are testing. Run the Delay Finder, and tap Set as Baseline. Now, you can move the microphone to a different location, run the delay finder again, and see the exact delay in time and distance. You can also enter the temperature of the air in the room, to get the most accurate distance calculations.
You can also change to another driver, and compare the delay for this driver to your reference driver. If you get negative delays, that means that the driver you are testing has less delay than the one you used to set the baseline. Just reset the baseline to zero out this driver, and go back to the other one and remeasure it.
Note on Using The Internal Generator
When you are using the internal generator, the first time that compute the delay you may notice a very large delay time and distance being computed. This is normal when using the internal generator, and the built-in mic or an external microphone. It is due to the iPhone audio latency between the iOS audio output and input that varies greatly, from device to device, and even from one run to the next. Follow the instructions above to correct this delay.
Setup
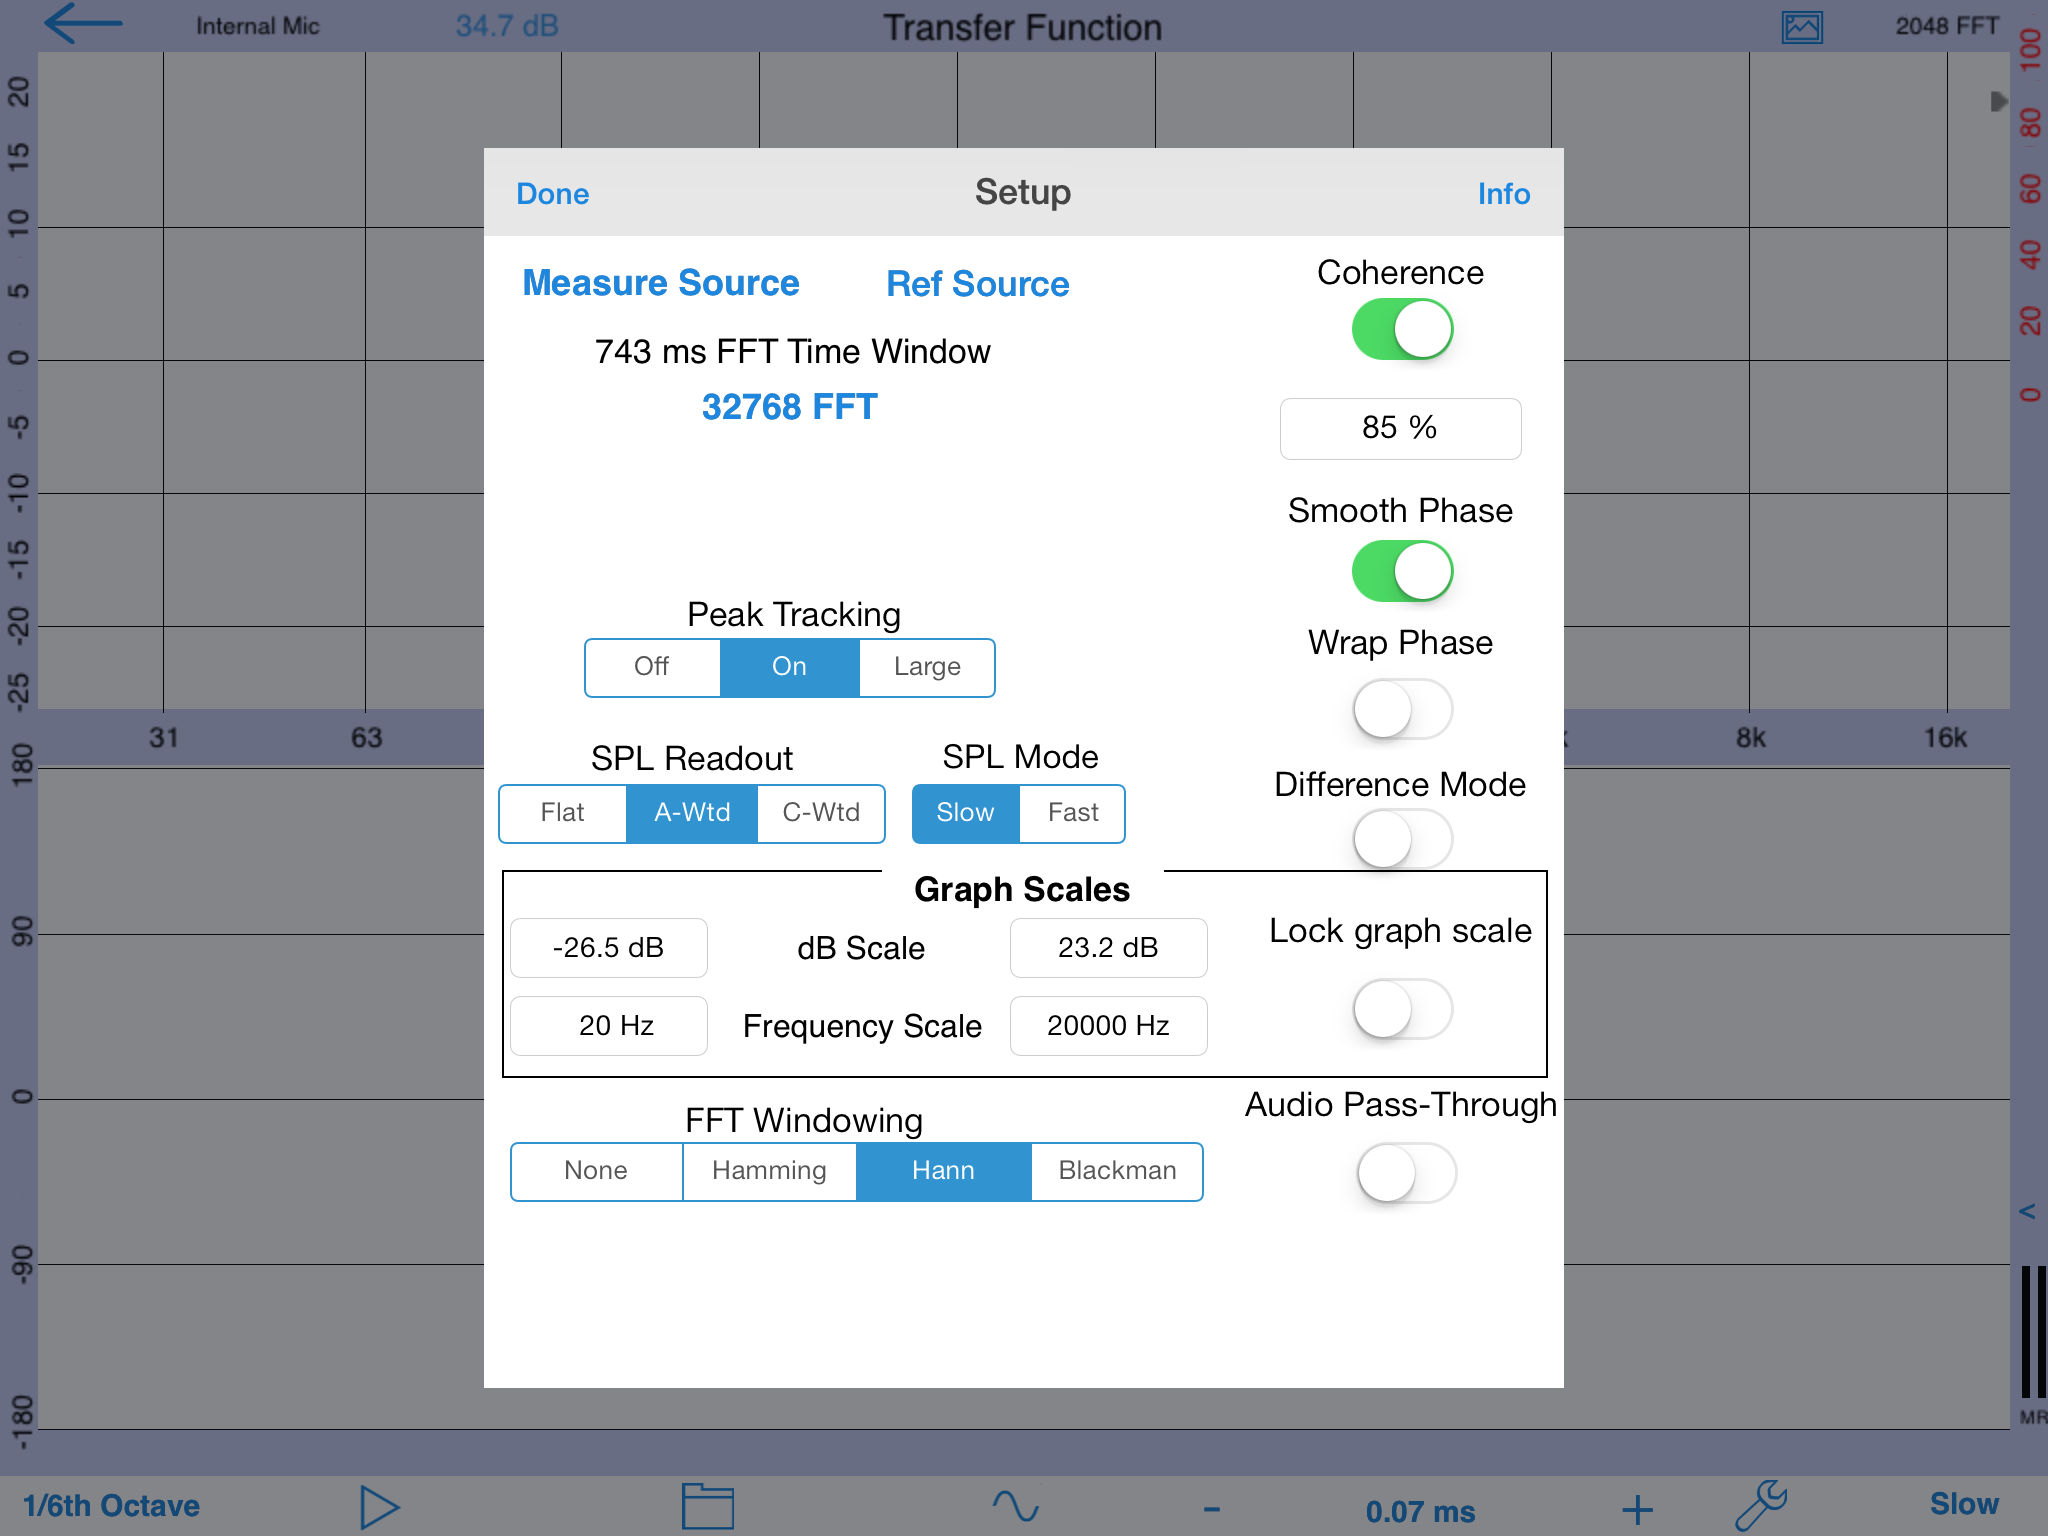
Select the FFT size and windowing, display type, turn Peak Tracking on or off. Select the SPL readout and decay speed.
The Measure Source and Reference Source are selected from this screen.
The Coherence Blanking percent will blank out parts of the magnitude and phase plot that have coherence lower than the value. The switch turns the Coherence plot on or off.
You can also engage Difference Plot Mode, control audio pass-through, turn on Difference mode.
The graph scales may be set manually, and you can lock the graph scale so that the touch-GUI is disabled.
The Phase plot may be smoothed, or you can leave it unsmoothed to see the full phase detail. You can also select whether or not you want to wrap the phase plot when it exceeds the plot bounds.
Using Transfer Function with iTunes
When you are using iAudioInterface2, it’s easy to use music as the test signal source for Transfer function.
To do this, you will have to run at 44.1kHz sample rate, because iTunes will not run at 48kHz, which is the sample rate that we
For the full user guide, Click Here