Technical Discussion
Sweep File for External Mode
Subwoofer Delay Test
LARSA is a powerful impulse response and analysis measurement tool. It is ideally suited for measuring loudspeakers in rooms, multi-speaker setups, car audio systems, home theatre systems or larger, installed speaker systems.

Available in AudioTools on the App Store
The Basics
LARSA is an acoustic measurement tool that mathematically compares a reference log sine chirp signal to that same signal measured through a transducer and room. This is useful, in that by subtracting the measured signal from the reference signal, what remains is just the impact of the speakers, other devices in the signal chain and any room interactions.
There are a number of ways to record this signal. With our iAudioInterface2, you will plug in the line output of the interface into the input of the speaker you want to test. You will plug in your measurement microphone into the microphone input of the interface and set up the microphone in the location where you wish to measure the response.
With our iTestMic, the configuration will be the same, except you will use the line output of your iOS device to feed the measurement signal into your system.
Finally, you can use the internal microphone to capture the measurement signal, although for best results, a measurement microphone should be used.
External Trigger Mode *NEW*
External Trigger mode is now
available. This allows you to use another sound source, rather than the iOS
device that is running LARSA, to generate the chirp signal. The advantage is
that you do not need any connection from the iOS device to the sound system, so
you can use LARSA for example with a surround sound system, by using our Apple
TV 4k app, “Surround Generator” as the source for the signal. In this case,
after downloading and installing Surround Generator on your Apple TV 4k, you
can select the Atmos signals, and then choose LARSA as the signal type for any
channel in the system.
To enable External Trigger mode,
on the Setup page, select “External Chirp”. Next, download the signal, either
from our website on the Downloads page, or by using the Surround Generator on
an Apple TV 4k.
Now, when you tap “Measure”,
LARSA will wait until it detects a signal at the trigger level on the setup
page, and then capture the chirp. From here, processing proceeds as usual.
Note that since External trigger
mode waits for an incoming signal, it cannot determine absolute time of
arrival, and therefore the speaker time delay cannot be computed. The waterfall
plot will still show the room decay, minus the initial arrival time of the
signal.
Setup
The first step you need to perform is to take a reference measure to determine the latency of your system.
NOTE: This applies to Internal Trigger mode only.
External trigger mode does not support delay measurements.
Tap the wrench icon and in the ETC Graph setup screen you will see a Latency box. Set this to 0.0s that start.
Then tap done and place the microphone as close as you can to the transducer you wish to judge. Set the gain of your microphone preamp by tapping the Gear icon, and then Microphone Setup. For complete calibration and gain adjustment instructions, please refer to the instructions in the Settings screen.
Tap the Measure button to take your first measurement, a log sine chirp signal will be recorded and through a process known as deconvolution, the resulting impulse will be generated.
To set the latency, switch from the Analysis Curves screen to the ETC Screen by tapping the second grey icon on the bottom middle of the module. The ETC, or energy time curve shows how energy is decaying in your room. First, assure that the 1.00s option is selected in the ETC graph. Use a single finger drag to slide the cursor to the peak of the impulse response and observe the time readout. This is the reference latency of your system. Tap the wrench icon again, and type the time value you observe into the Latency field.
This time tap the 0.020s button on the ETC Curve graph, your new measurement’s peak should be 0 ms. If it is not, adjust your latency settings until your close mic is measuring 0 ms delay and distance. Once that is set, as you move around your room and make other measurement, the delays and distance differences will be meaningful.
Basic Measurement
There are two basic ways to use this module. The first is to make individual measurements of different loudspeakers or measurement locations around your room. The other is to make multiple spatially-averaged measurements of the same loudspeaker.
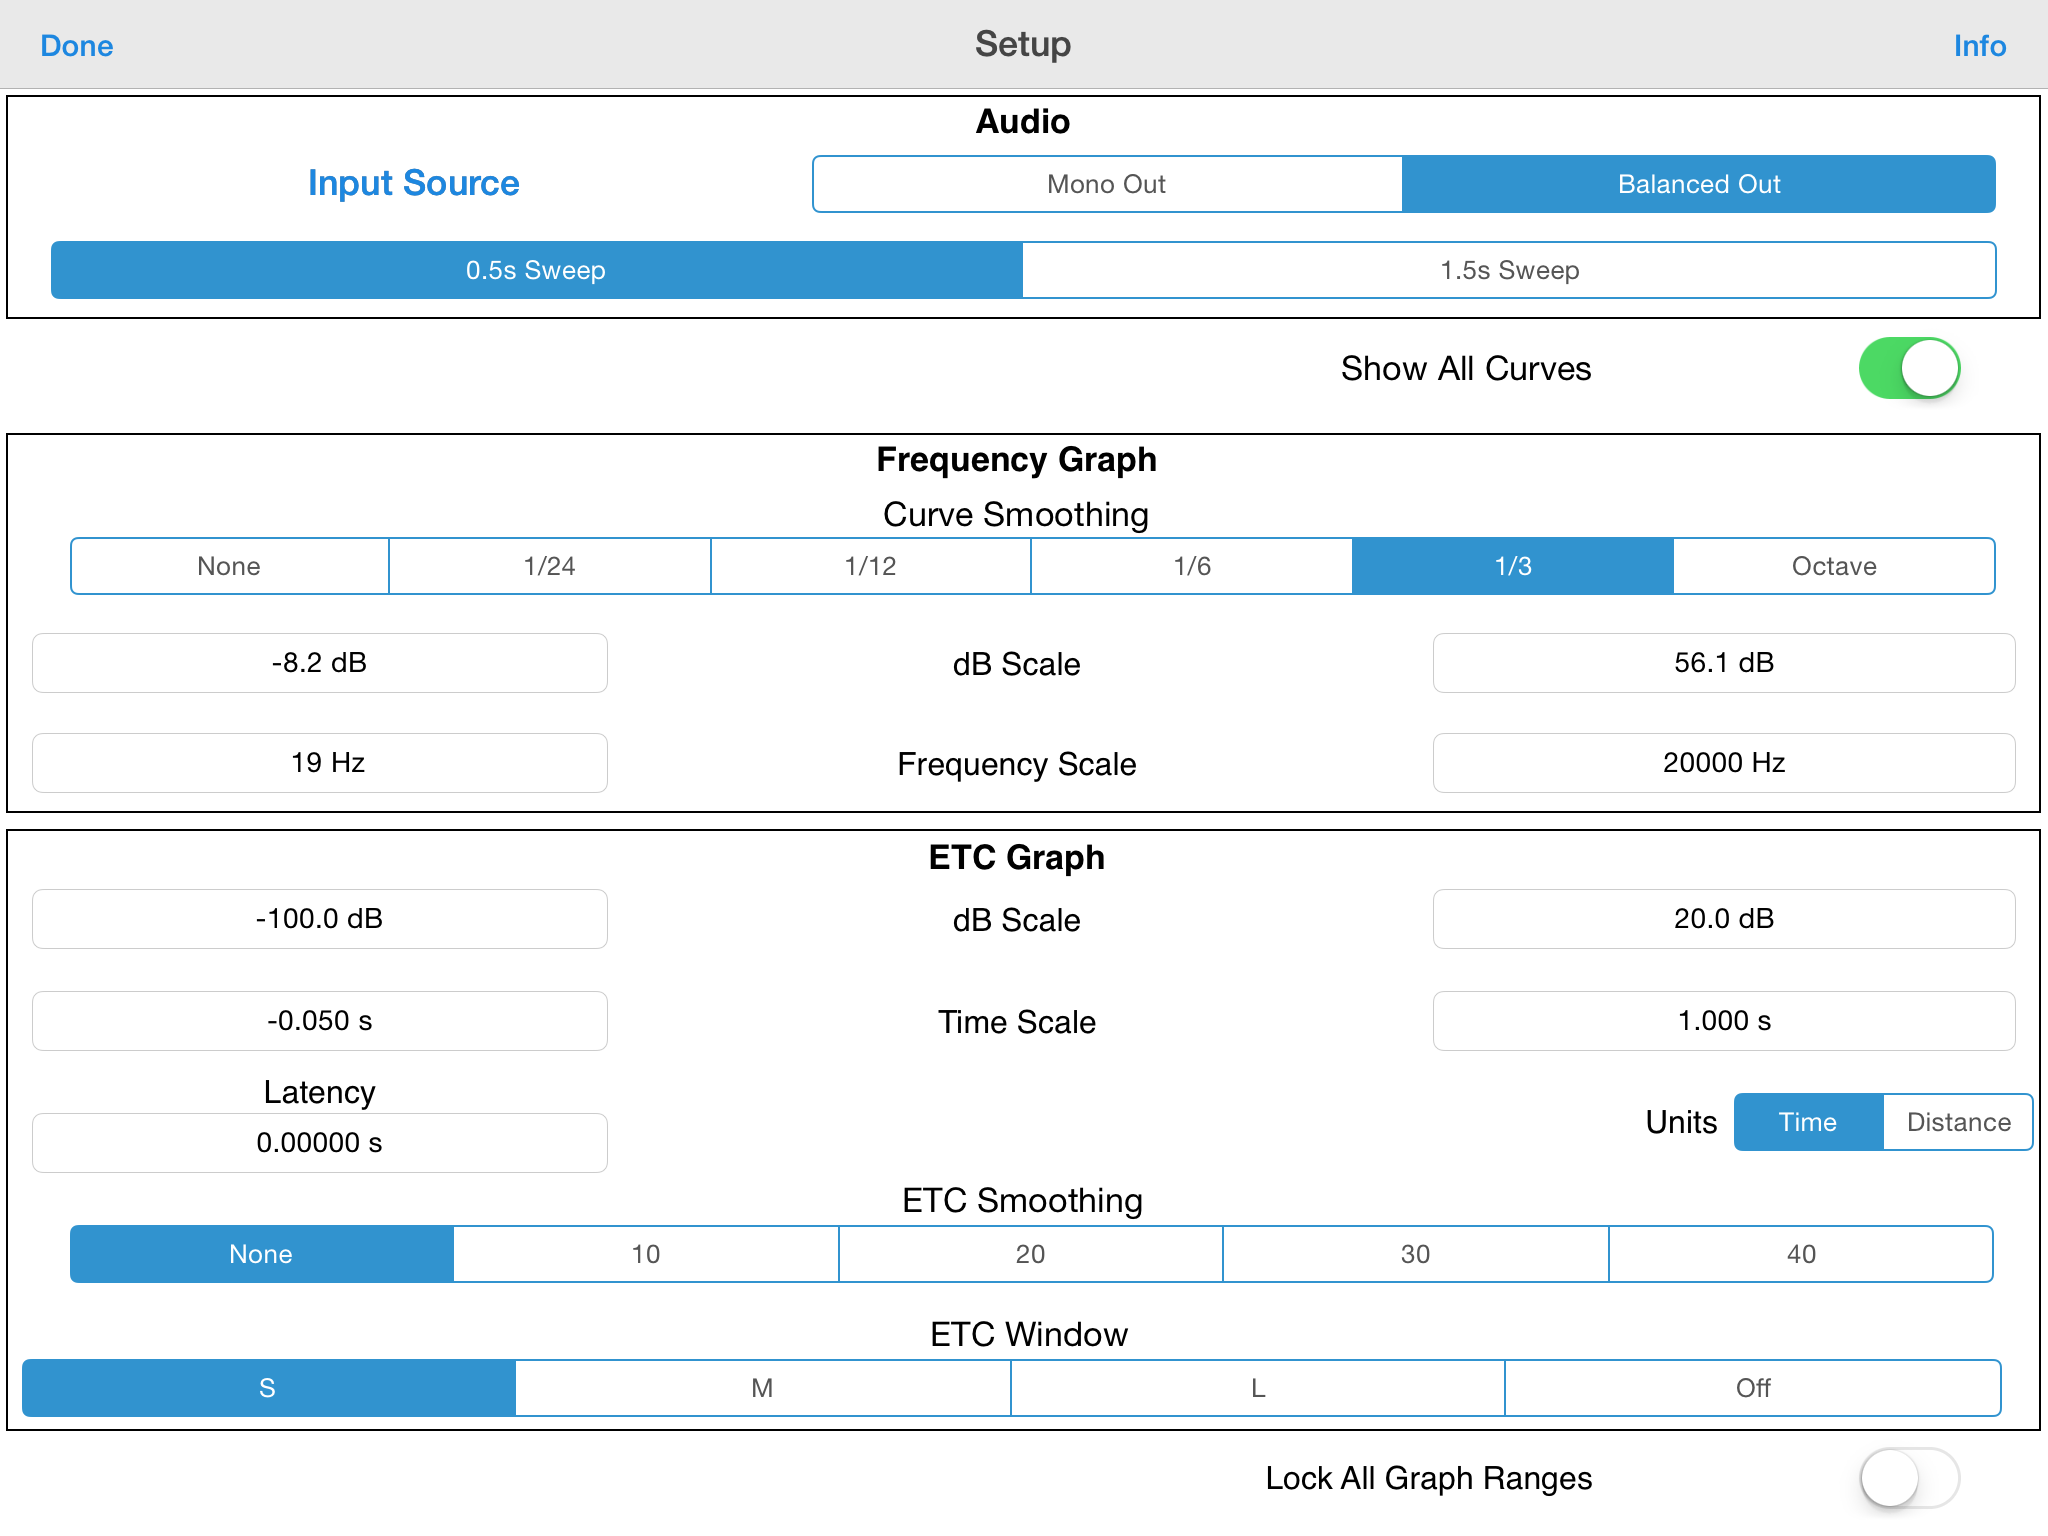
We will start with the first case where you wish to measure a small studio monitor in a close microphone configuration (as close to the transducer as possible), at the listening location and then at multiple locations in the diffuse field. You have two options for chirp lengths, which can be selected in the setup screen. The 0.5s chirp give you good resolution and a quick measurement time. The 1.5s chirp gives you a bit more resolution in the lower frequencies, which is useful if you are measuring large loudspeakers that have an extended low frequency response or subwoofers.
If you are using External Mode,
only the 0.5s chirp is supported.
The chirp measures from 10 Hz – 22 kHz, so please be careful of the output volume to your loudspeakers. Protect your hearing and your equipment. If you are measuring for an extended period of time, please use ear plugs. In the Audio section of the Setup pane, there is a Test Tone option, which will toggle a sine tone for level setting. Assure that the signal is intense enough, but not too loud that it will distort your microphone input.
In addition to the chirp length setting, you can also select whether you are using a Balanced output or a Mono output, and select the input source.
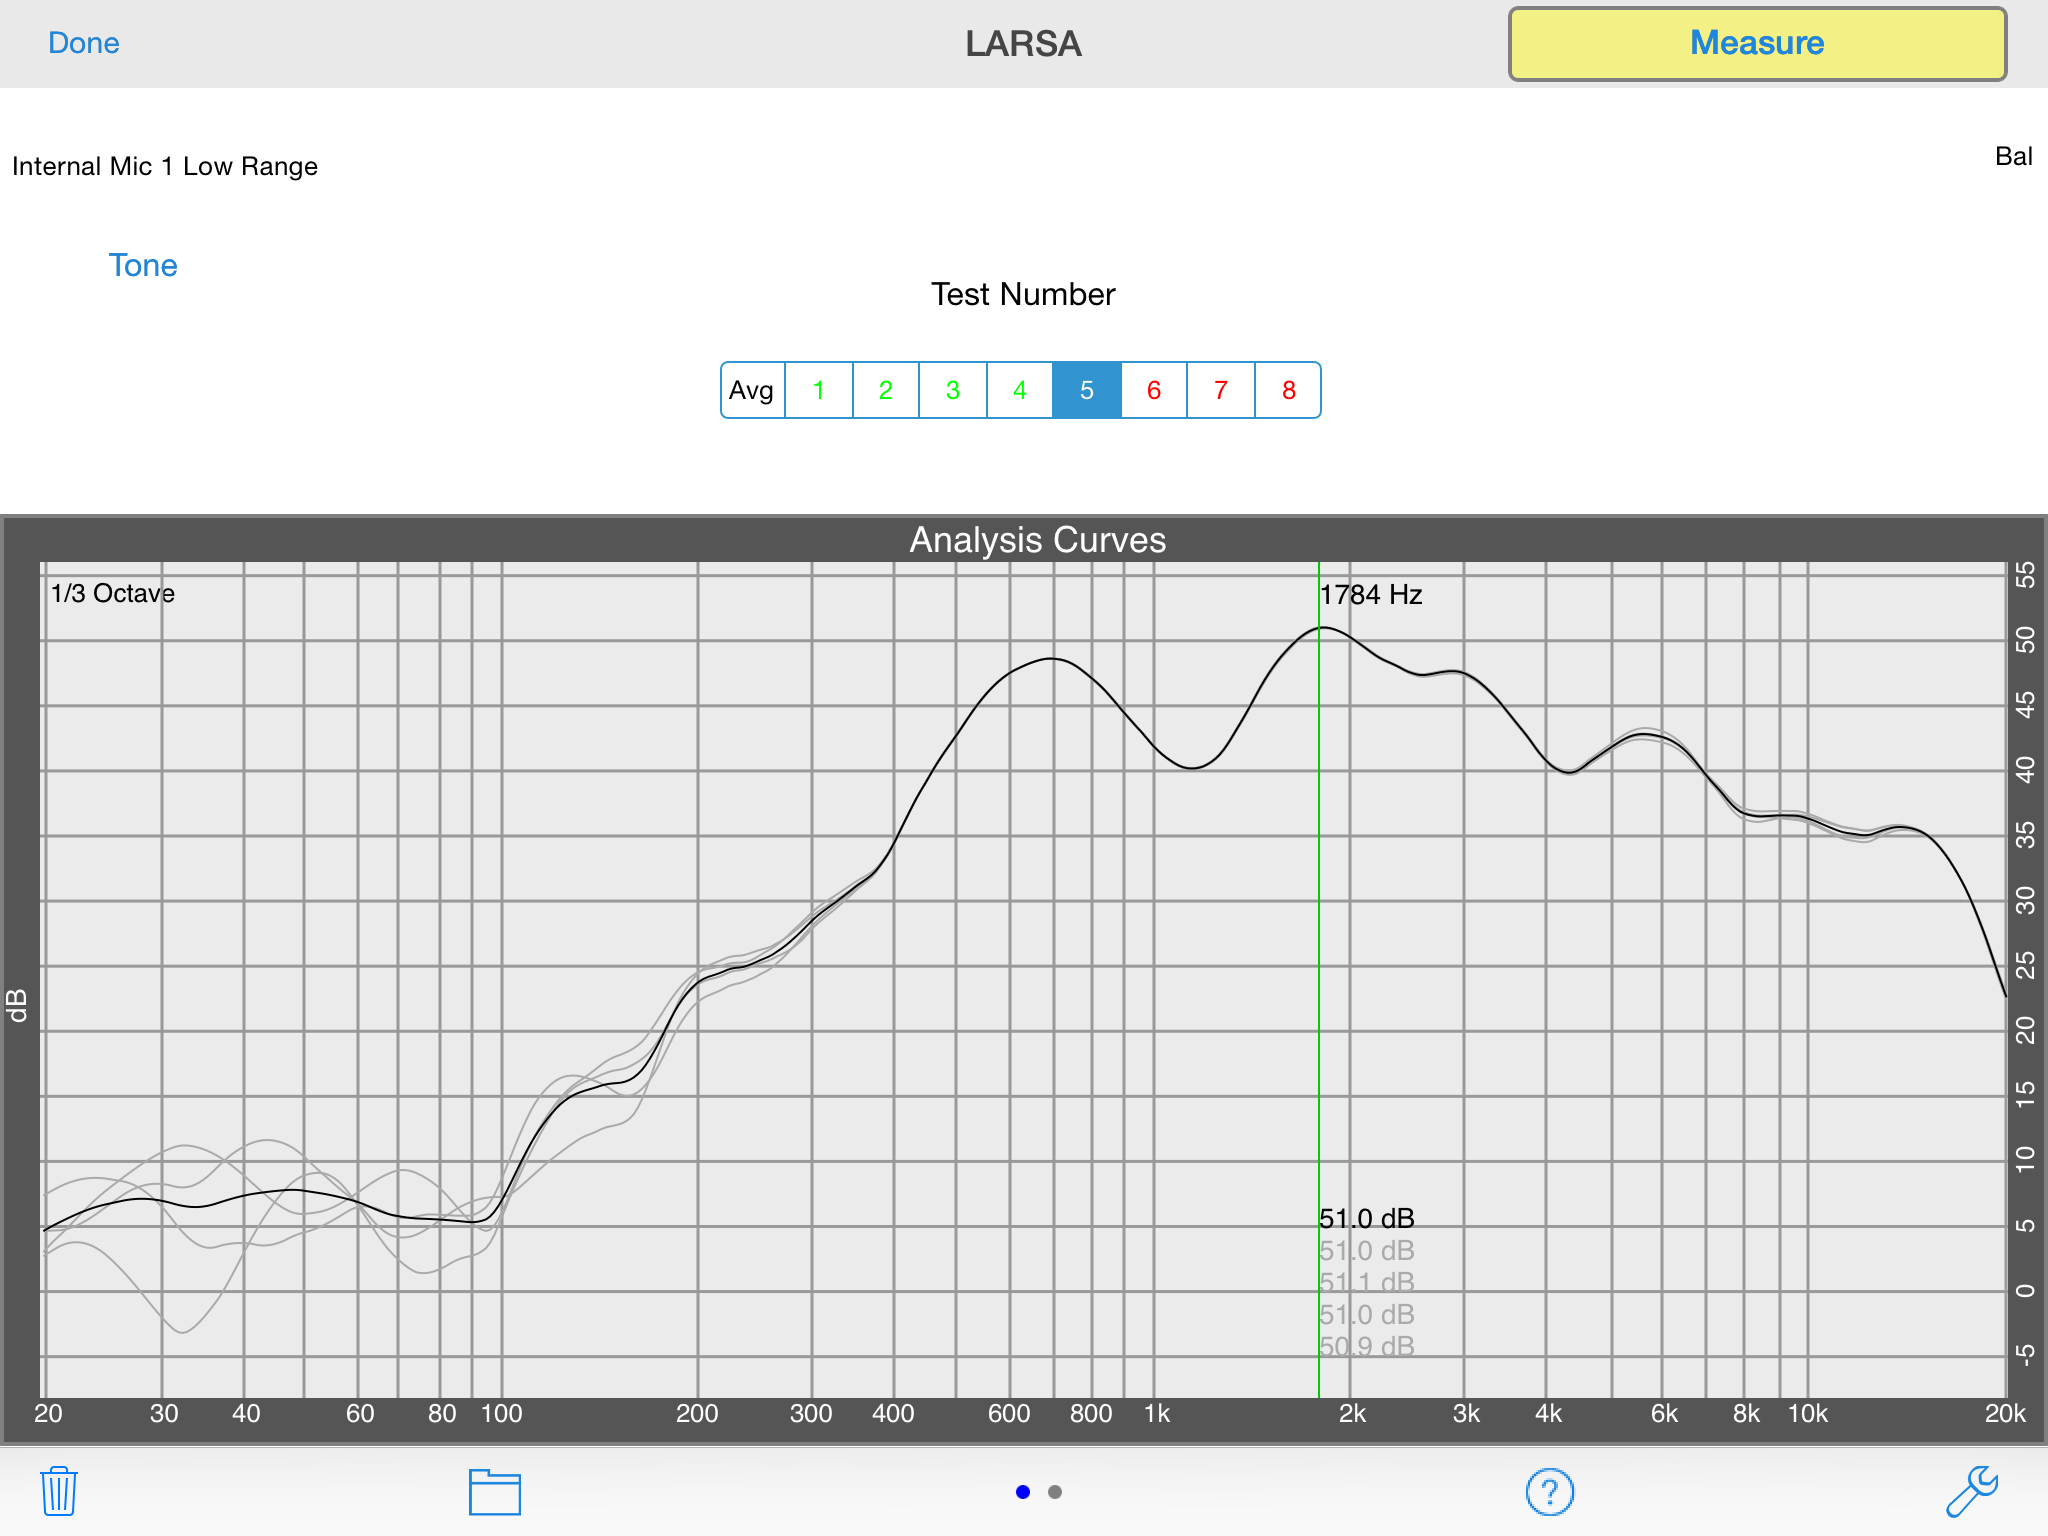
Back in the main screen, we are ready to make a measurement. Tap the 1 Test Number, position the microphone in the close microphone configuration (as close as you can get to the transducer). Now tap measure. In the Analysis Curves graph, you will see the frequency response of your measurement. The currently selected measurement in the Test Number will be traced in blue. Test Numbers that have a stored IR will be displayed in green text, and open locations will be displayed as red text. The Avg shows the average frequency response of all measurements.
The frequency response graph can be smoothed. In the setup screen there are options for the Frequency Graph. Curve smoothing options from None to a full-octave smoothing are available. You can also manual set the ranges for the dB (Y) axis, or frequency (X) axis.
Next, move you microphone to the listening location (usually located in the sweet spot between your town monitor loudspeakers). Repeat the measurement process. Notice how the intensity of the frequency response has decreased because you are further away from the loudspeakers. Non of the responses are normalized in this module, so you can see the level differences and time difference in multiple measurements.
Move over to the ETC Curves, assure that 0.020s is selected and notice how you can see that the second IR we’ve measured is further back in time than the close mic IR. This is because there is a delay now introduced by the distance from the loudspeaker to the microphone. Drag your finger onto the plot the measure this delay. Line up the vertical cursor with the second peak and you will see the ms delay and the delay in distance.
Move your microphone to the third measurement location and repeat the process. You can repeat this process for up to 8 measurement locations in the room.The store your results, tap the folder icon. For complete Save / Recall instructions, please refer to the info in this screen.
If you have inadvertently made a spurious measurement, or wish to clear the memory in the Test Number boxes, highlight a Test, and tap the garbage icon. The module will prompt you the clear this test (the one highlighted), all tests or cancel. All tests will remove all of your measurements from memory, no matter which one is highlighted.
Spatial Average Measurement
A useful technique for characterizing how a loudspeaker sounds in a room is to measure a spatial average around the sweet spot. In the setup screen there is an option to show location prompts. Turning this on and selecting an analysis area similar to your listening configuration (single chair vs. a couch), will give you approximate locations for each of the 8 tests to measure.
The technique here is to measure IRs around the listening location and take an average of all 8. This helps to smooth out modal behavior and gives you a reasonable impression of the frequency response that you are actually hearing. This technique is useful for setting tone controls, or equalization of your system.
Start again by setting your latency as instructed above. Tap the test number 1 and place the microphone where the location prompt shows you to with the microphone pointing up at ear level. Continue the same process for the remains 7 measurements. Then tap the average button. This should be a reasonable approximation of the frequency response of your loudspeakers in your room. Note, you are not looking for a flat response here. Most systems that sound perceptually flat have a slight elevation of the response from 20 Hz – 20 Hz, are flat to 1 kHz and then have a gradually dropping high frequency response towards 20 kHz. To see just the Avg measurement, and not the individual ones, enter the setup screen and turn off the Show All Curve switch. Then tap done and tap the Avg Test Number.
Measuring Multiple Speakers in the Same Location
Another measurement technique that you can use Room EQ for is to make measurements of multiple loudspeakers at the same location. We will take the case of measuring a 5.1 surround sound system in the sweet spot of a home theater.
Again, I will start by making the reference latency measurement, and then place the microphone in the sweet spot with the diaphragm pointing up. Tap test number 1, and route the signal to the left loudspeaker. Measure the response. Tap test number 2, route the signal to the center signal and measure the response. Continue measuring the right, right surround, left surround and subwoofer in the same way.
Now you can compare the frequency response of each loudspeaker as well as the arrival time by inspecting the ETC Curves Screen.